Data Set
HR Data Set from KaggleTechnology
- Python 3.11
- Pandas
- Numpy
- Matplotlib
- Seaborn
- HTML / CSS / Javascript
Scenario
The HR team has collected the data to better understand the company’s landscape. They would like to answer the following questions:
- We would like to know the breakdown of current employees. We've been given more resources for new hires and are looking to fill potential holes in the various teams.
Can you make any suggestions as to which teams may require more assistance? - We need to update our new hire salary offers to better match our current employees. Could you provide us with offer suggestions based on department and position?
Results
Employee Breakdown
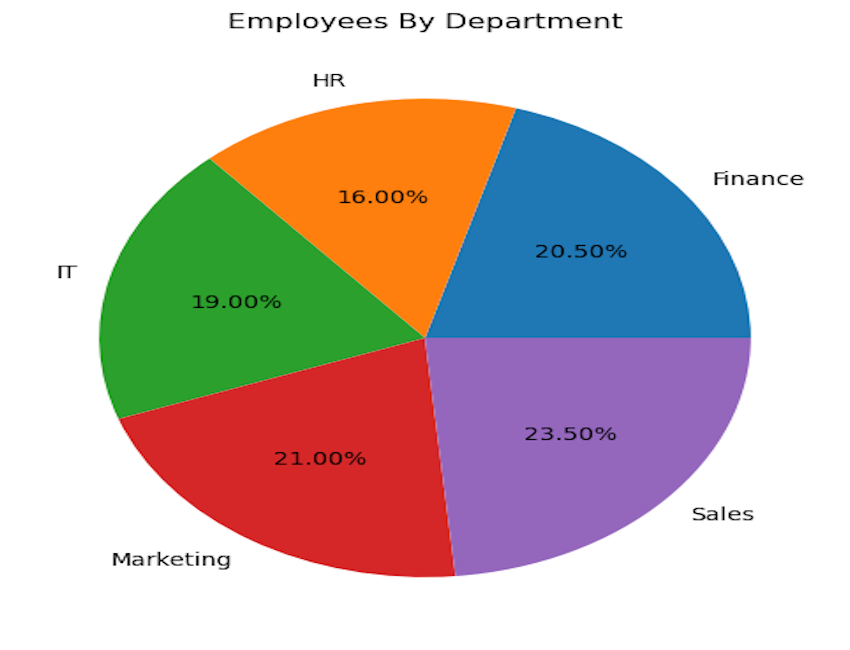
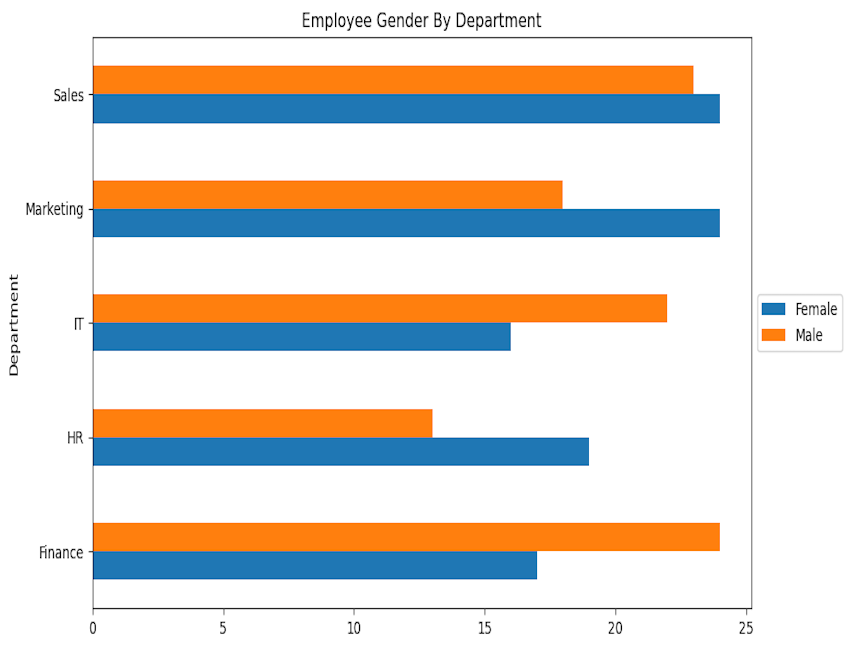
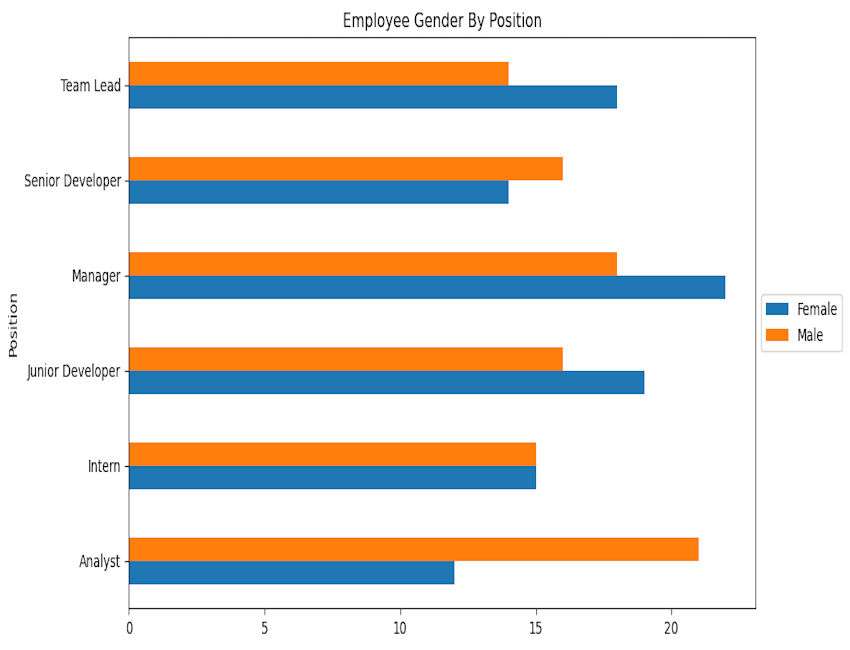
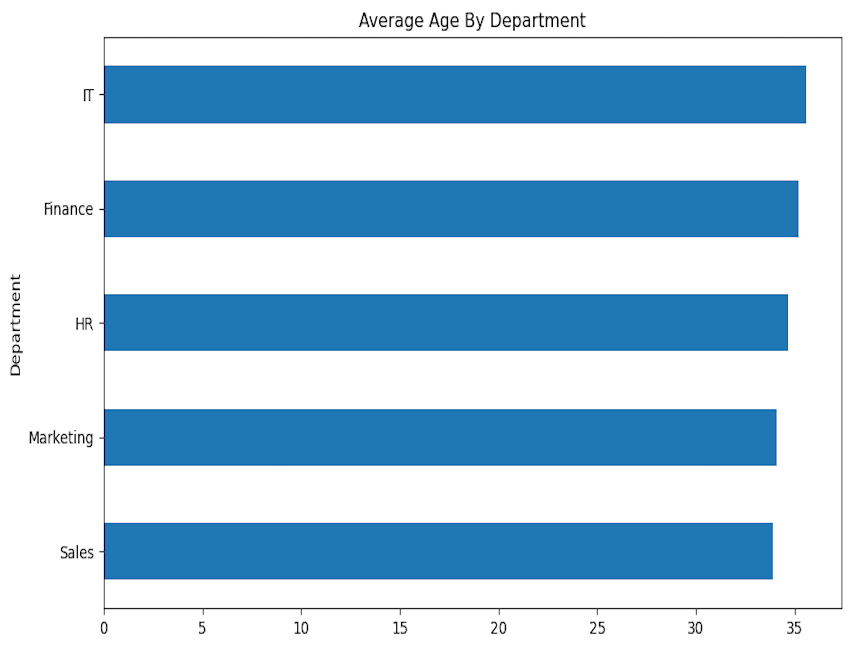
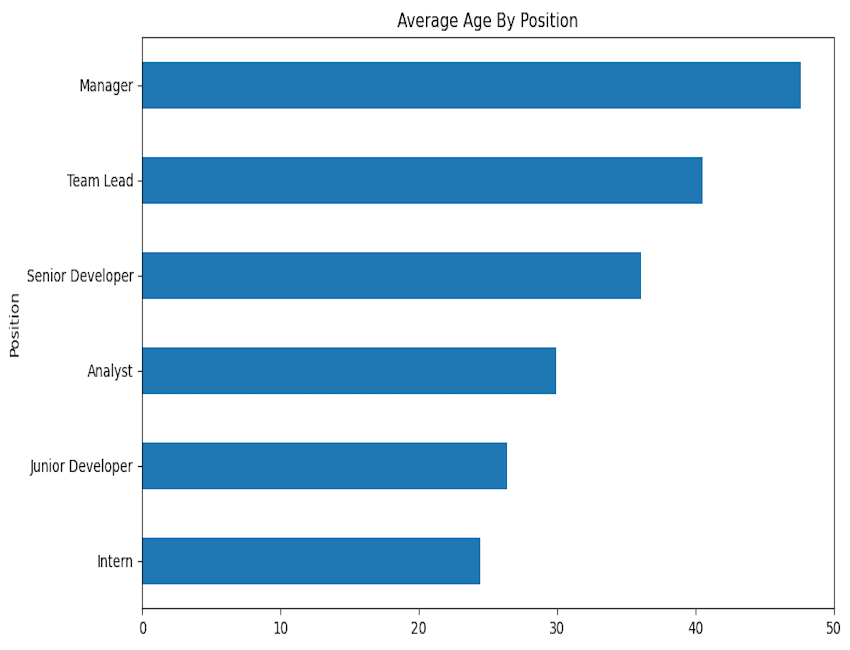
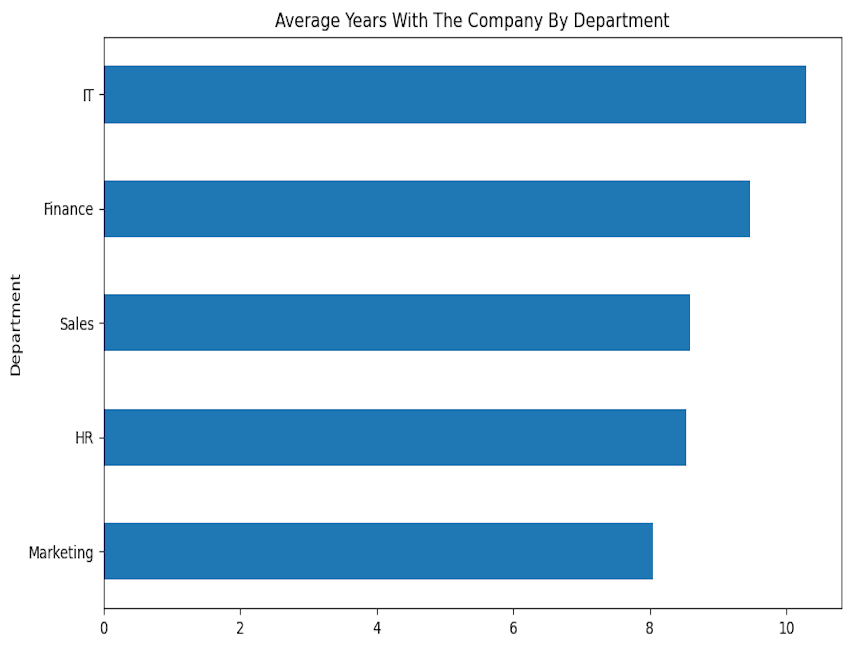
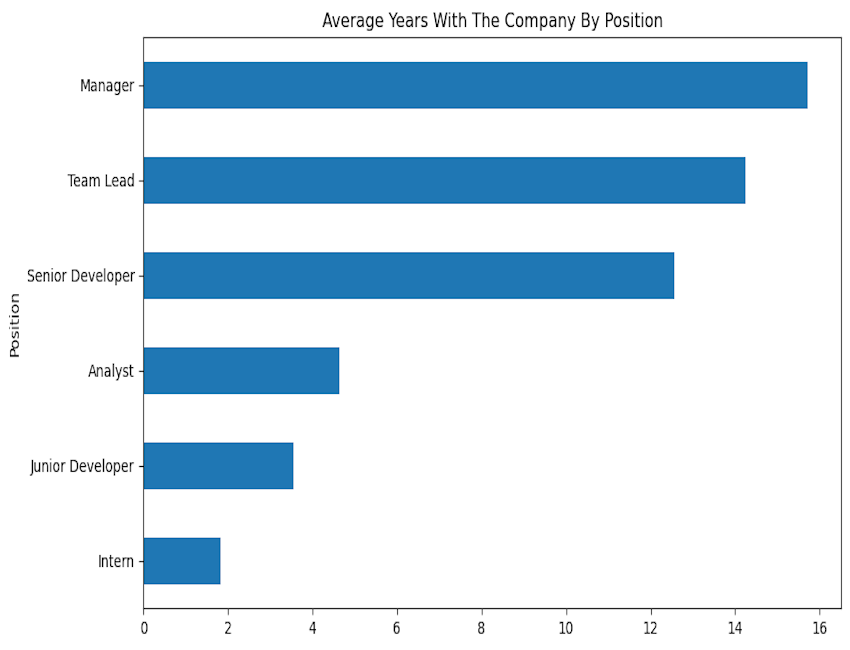
The Finance, Sales, and Marketing teams have the largest number of employees. While the more support orientated IT and HR teams have fewer employees. The company shows strong gender diversity across the department and position breakdowns. The employee age across the departments is uniform and increases as the positions move from junior to senior roles. The average Company Years across the departments is also uniform, but the average Company Years across position is interesting.
If the Junior Developer role leads into the Senior Developer role, and similarly the Analyst role leads into the Team Lead role, we have a large gap in terms of average company years. The Developer and Analyst would on average spend roughly 10 years in these roles before moving upward. If this is by design, then feel free to disregard, but if not, this may be an area we could look at implementing programs/training to help facilitate career advancement.Hiring Suggestions
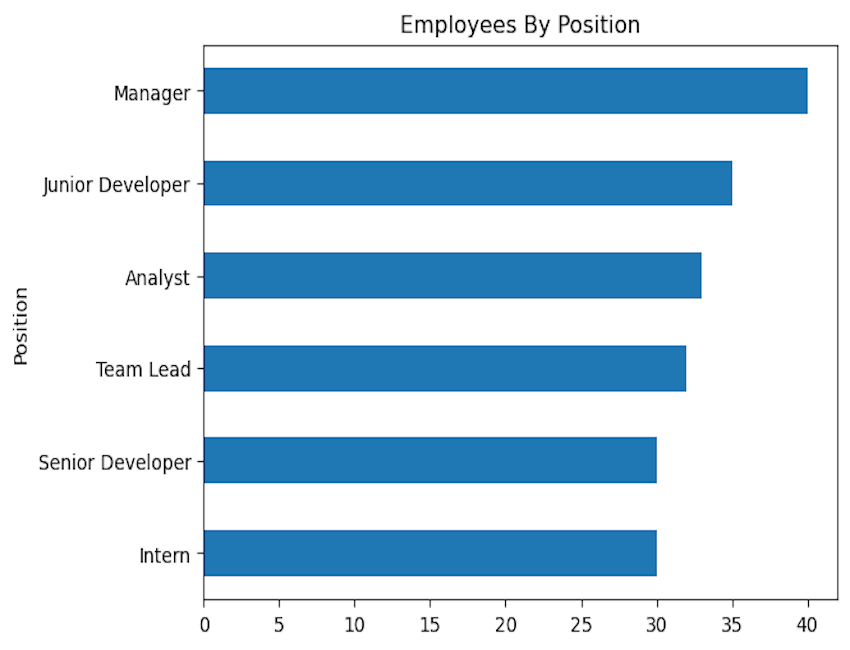
More employees hold the manager position than any other in the company. Let’s dig a little deeper to see which teams have the most managers, maybe they would be able to take on more junior new hires.
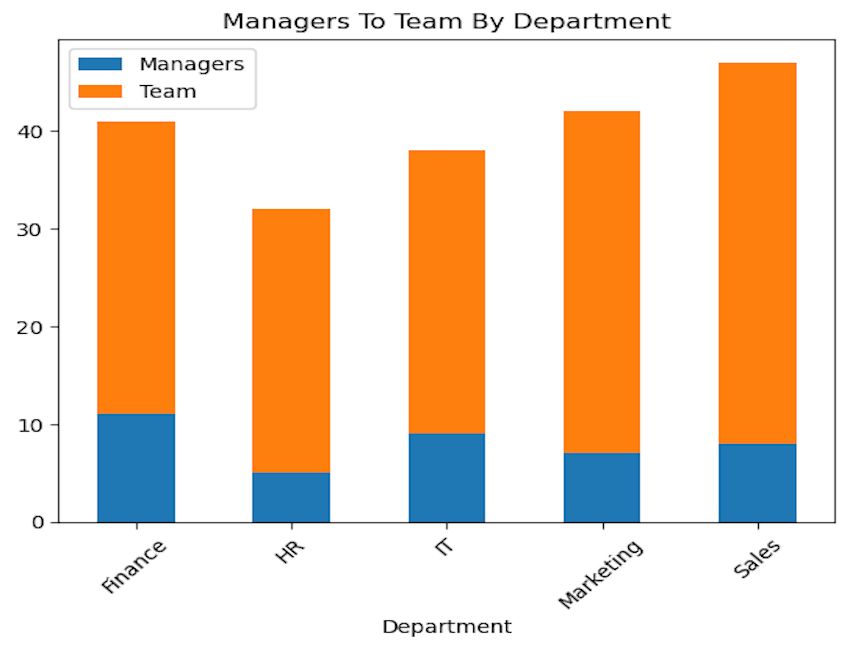
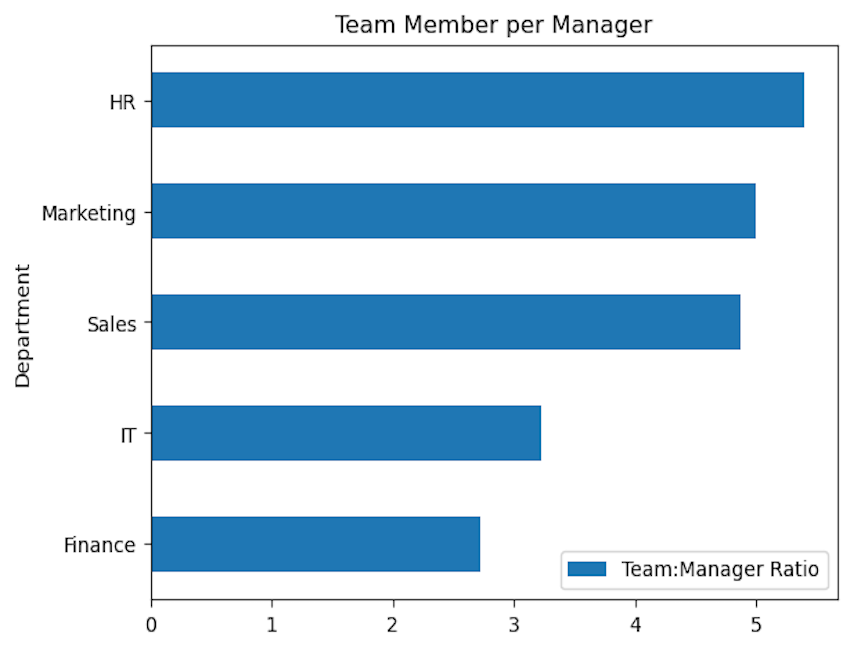
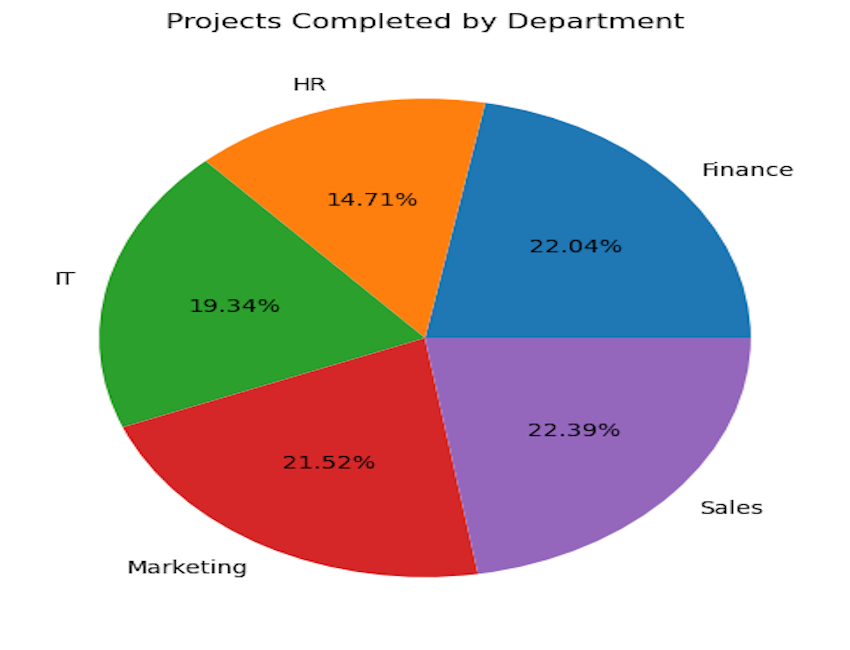
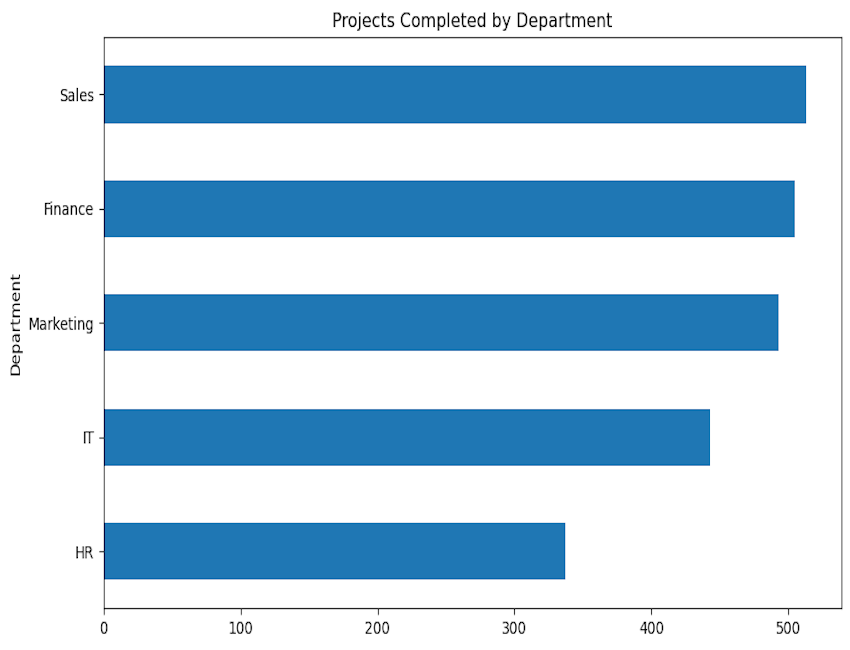
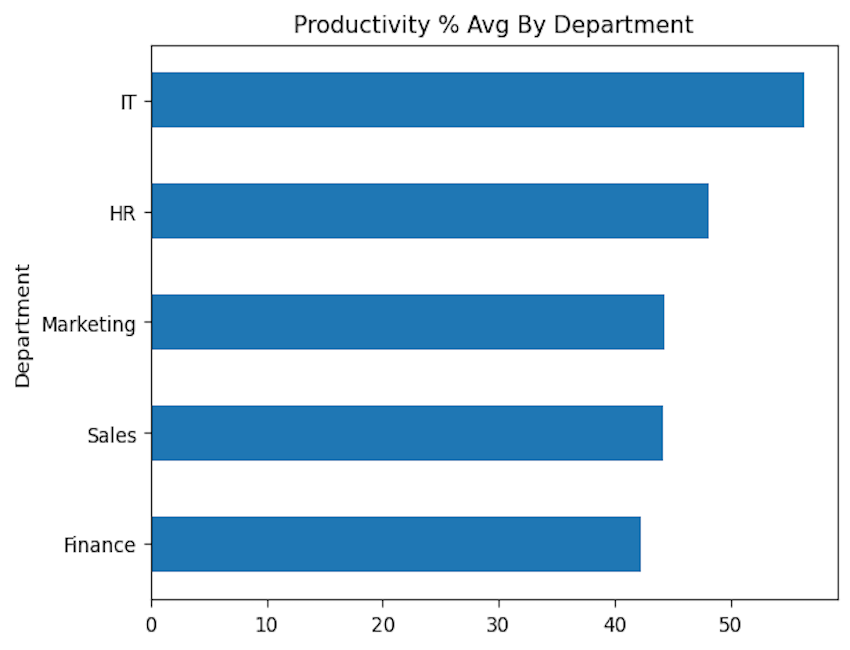
The manager position is the highest filled role in the company. With the Finance and IT departments having around 3 team members per manager. If the HR team is looking to fill out more junior roles in the company, these two teams are attractive because they have the best team member to manager ratio. The Finance department also has the 2nd highest number of completed projects and the lowest average productivity percentage. The IT department has roughly 50 less projects completed but does boast the strongest average productivity percentage. I would suggest adding junior new hires to the Finance department.
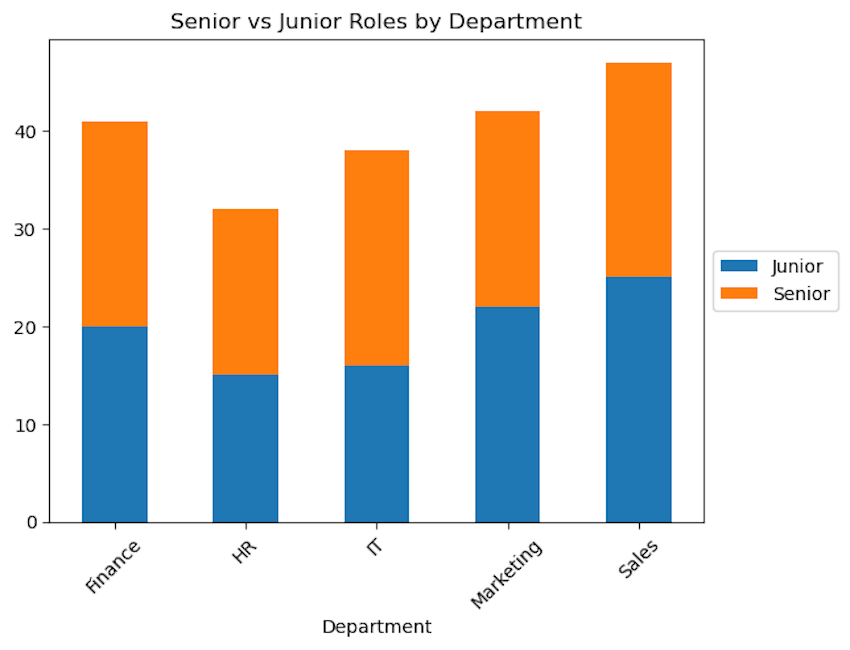
If the HR team is looking to hire more leadership positions, I would suggest adding Senior Developer's to the Finance department, it is the 3rd largest department in the company, but has only 10% of the Senior Developer's. If you are looking to reduce the Team member to Manager ratio; I would suggest adding Managers to the Sales and Marketing departments. These departments lead the company in number of completed projects, have an average productivity percentage, and have a 5 to 1 team to manager ratio. Decreasing this ratio may lead to an increase in productivity and completed projects.
Note we did not suggest the HR department even though they have the highest Team to Manager ratio and the lowest project completion rate because they have the 2nd highest productivity rate in the company. This suggests that the companies support oriented departments may have fewer projects in total, but those projects tend to be larger in scope than the projects of the forward-facing departments.
Salary Offer Suggestions
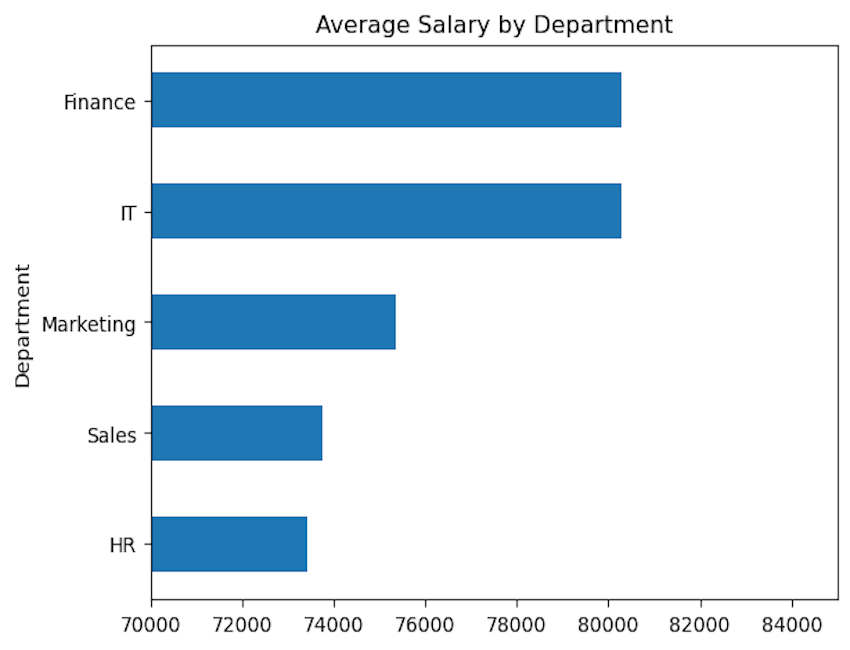
First, we looked at the average salary across the various departments. There is roughly a $7,000 average salary difference between the highest paid departments, Finance and IT, and the HR department which is currently the lowest. This is partially explained by the team member to manager ratio. The highest paid position across all departments is the Manager role. The Finance and IT departments have the lowest ratio's at around 3:1, while the HR department has the highest ratio at around 5:1. The more senior roles a department has, the higher the departments average salary.
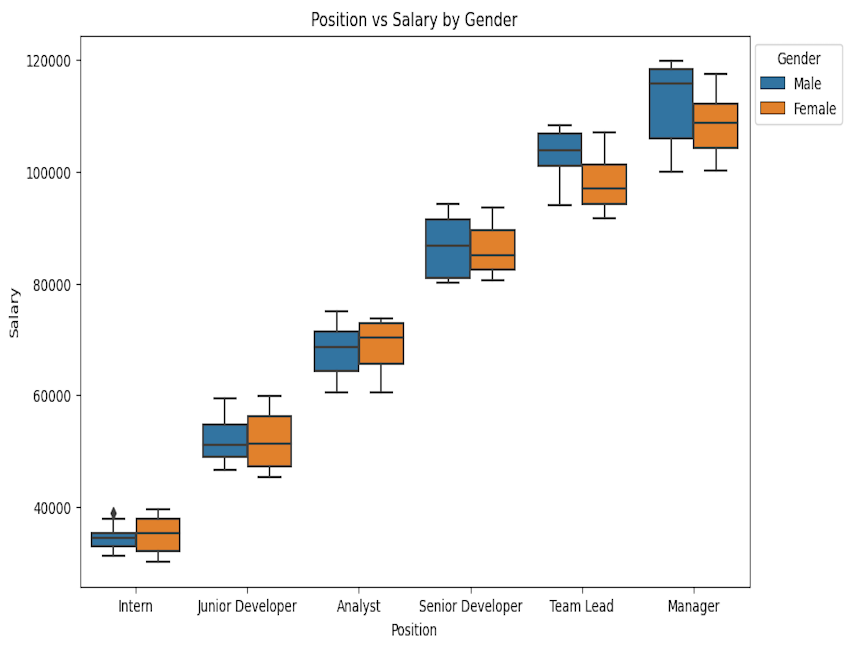
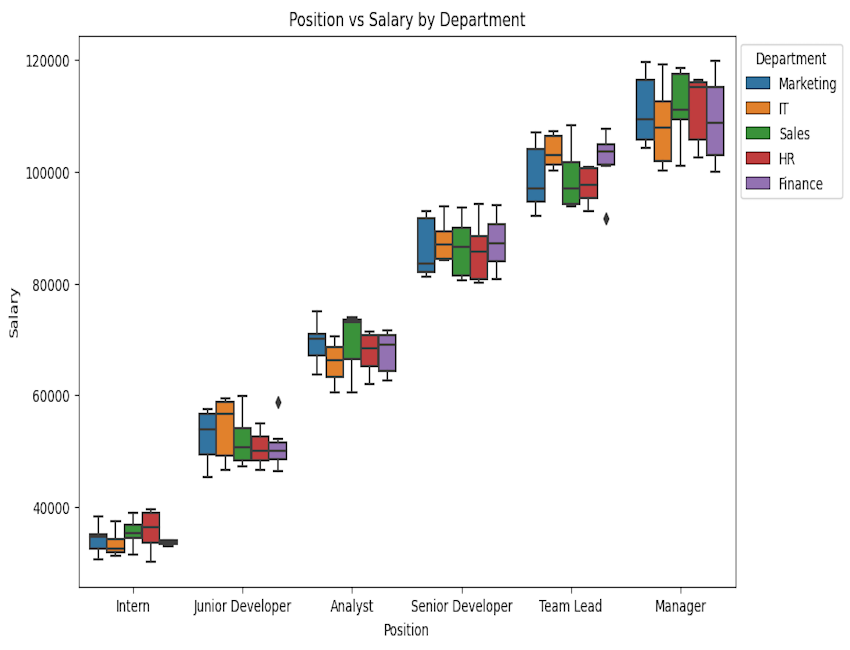
Next, we looked at the salaries of all positions across the companies’ departments and gender. The variation in employee salaries seems reasonable with all salaries within 15,000 of each other. We did manage to identify 2 salary outliers both in the Finance department, they are listed below:
- Brian Delgado Finance Team Lead 91680
- Brett Butler Finance Junior Developer 58688
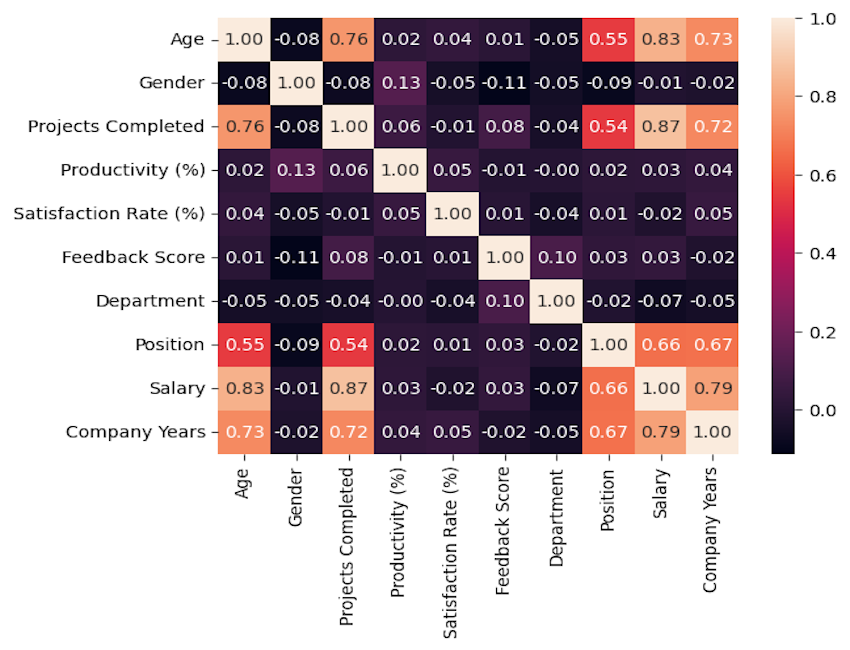
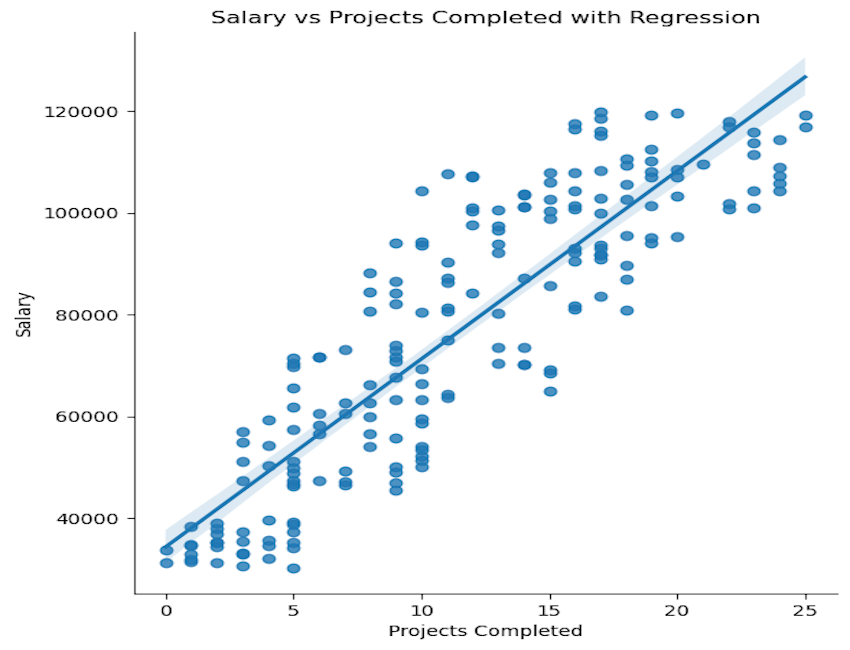
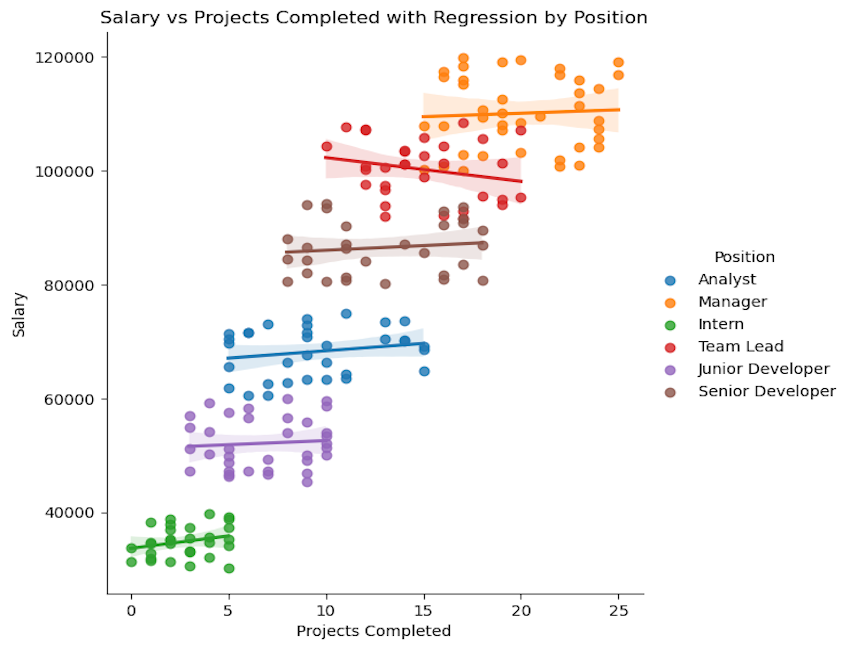
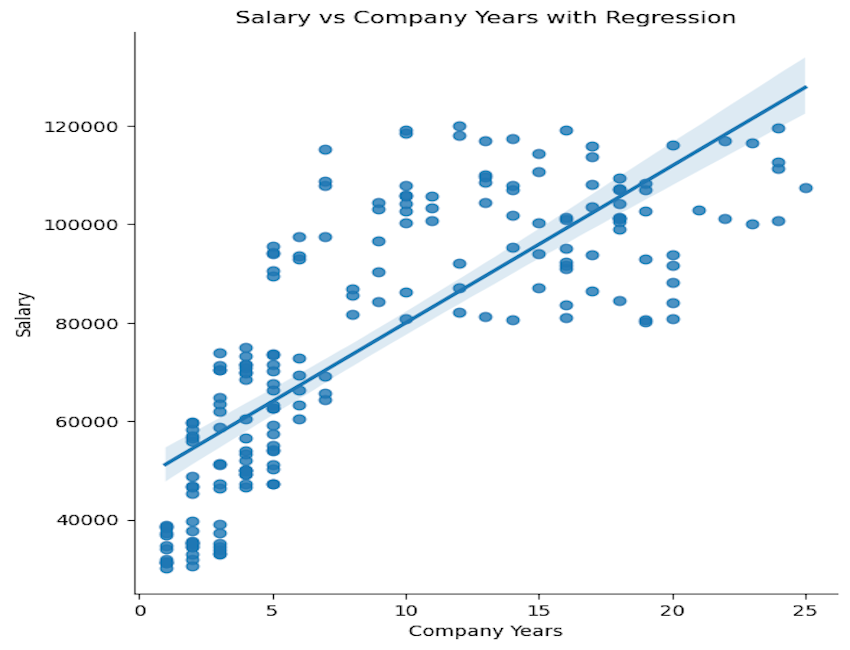
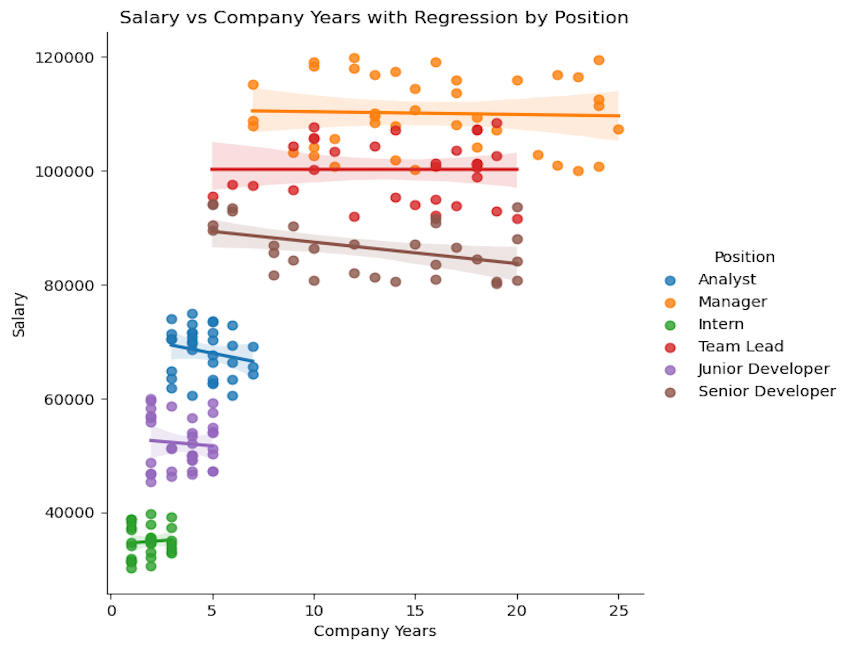
Finally, we created a heatmap using the Pearson correlation coefficient to look at what features may help us offer salary suggestions. Three features share a strong positive correlation with salary: Age, Projects Completed, and Company Years. We discarded the Age feature because it probably won't impact on our salary offer and is somewhat implied by the other two features. Each feature has two plots, the first shows the overall regression line for the overall plot, and the second shows the regression line for each position. What is interesting is that the overall regression lines have a strong positive slope, while the regression lines of the positions within the same graph are much smaller and sometimes negative. This suggests that the salary of an employee might be set when starting a new position and does not increase over time.
Salary Offer Suggestion: Since we don't have a great way to gauge a potential new hire's Completed Projects, we will use their experience as the independent variable in the linear regression from the Company Years vs Salary plot. We will then threshold the estimation with the Minimum or Maximum for the current employees in the same department's position. Let's consider the following example: We would liek to make a salary offer to a Senior Developer candidate looking to join the HR department with 12 years of experience. First we calculate the salary offer based on the candidates years of experience:
Regression Formula: 3189.09 * (12) + 48013.07 = $86,282.00
Then we compare the offer to our current Senior Developers in the HR department, they make between $80,513.00 and $94,290.00, we consider the calculated offer good as it falls within the current employee salary bounds. If it fell outside these bounds, we would adjust our offer to the current salary minimum or maximum.
Salary Calculator
Future Analysis
With more time and resources, I would've liked to dive into the question of employee happiness. The dataset contains two features related to this idea: Satisfaction Rate (%) and Feedback Score. Neither of the two features share a moderate correlation with any other feature in the dataset. I attempted to look at the top and bottom 10% of employees based on these two features, still no real correlation with any other features. If I had more time and resources I'd like to collect the manager data for each employee, maybe their satisfaction is predicated on a particular management style. One final feature I would like to see is employment status, a field to determine if an employee was still with the company. Then over time we could look to see what factors may cause an employee to leave the company and attempt to predict what factors are critical to employee retention.