Baldur’s Gate Shop Sales Dashboard
The goal of this project was to create a SQL to Power BI end to end dashboard project. I wanted to simulate a database with fact and dimension tables. I was fortunate to find a data set on Kaggle (link below) that had sales data for a fictional shop based in the award-winning video game Baldur’s Gate 3. Even with the data being fantastical, it still had the table structure I was looking to explore. A handful of item tables and a customer table to act as dimension tables, and a sales table to simulate a fact table. The data had everything I was hoping to find missing values, data errors, and duplicate records. Below you will find the SQL queries and Power BI dashboard. I had a lot of fun working with the data and attempted to provide some form of narrative below. Thank you for taking the time to look at my project =)
Scenario
The owner of the Gearspark's Emporium for Adventurers in Baldur’s Gate, Fizzlewhiz Gearspark, has asked us to take a look at his sales for the previous seven years. Mr. Gearspark keeps very detailed records regarding his transactions, products, customers, and inventory. He would like to get a deeper understanding of what his customers are purchasing at the shop. Mr. Gearspark has asked the following questions:
- Can you show me our revenue year by year?
- Which products are the most profitable?
- What category of products are most profitable?
- What do our customer demographics look like?
- Is there any race/class/gender's we should be catering to?
- Who are our most loyal customers? We would like to send them special deals/info.
Technology
Dashboard
-Breakdown
-Data Cleaning
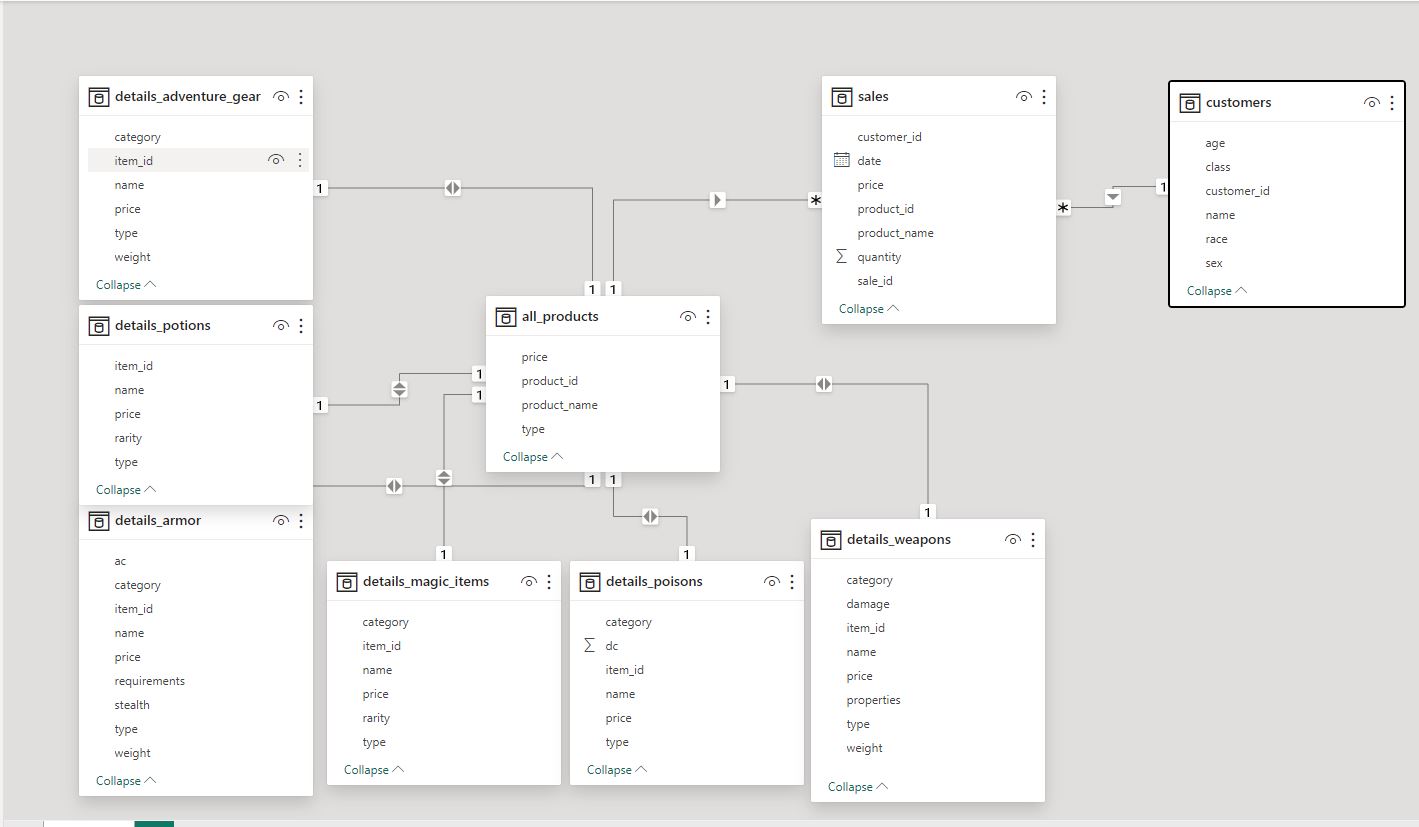
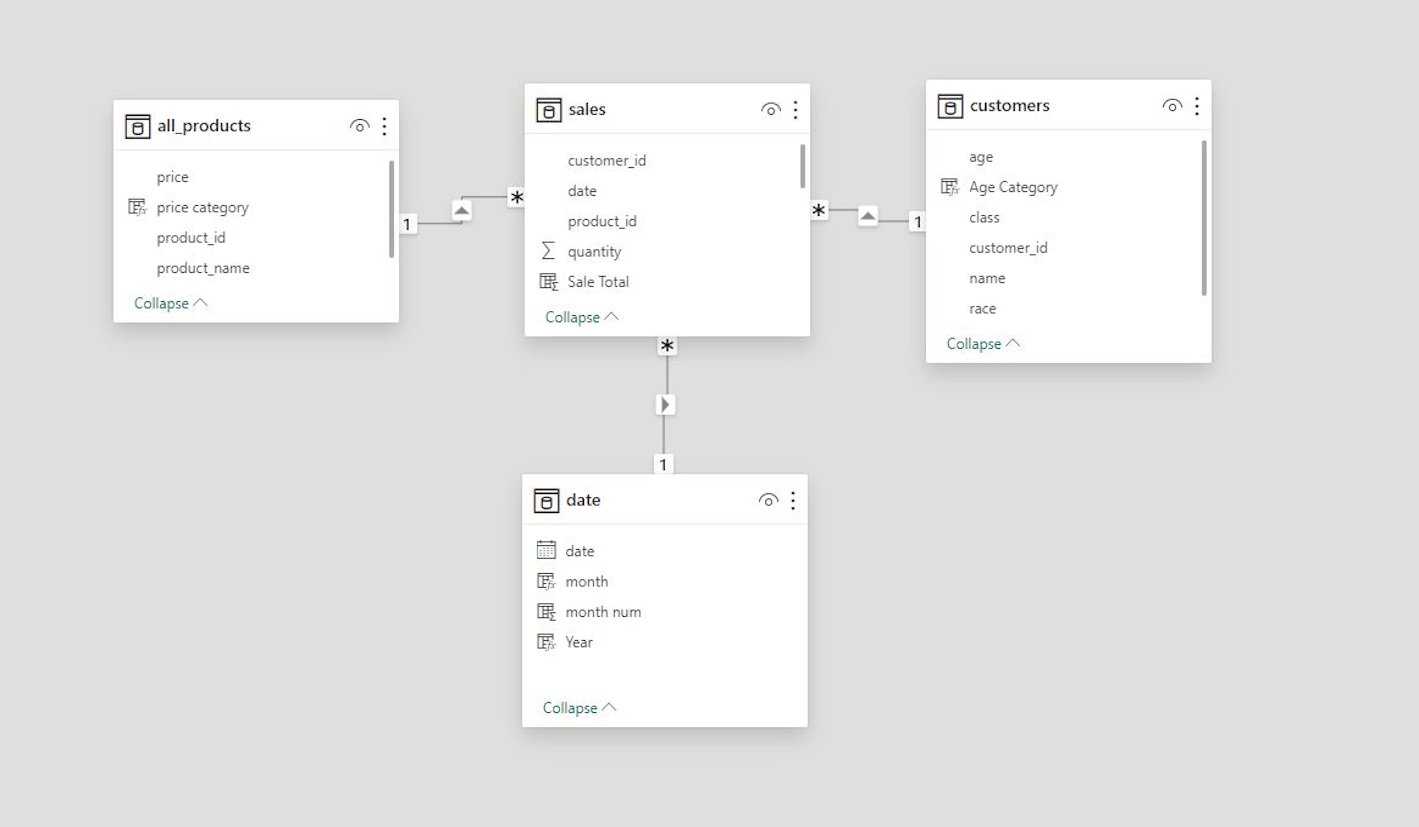
The data set from Kaggle is in a SQLite database, so I started by opening the database using DB Browser and extracting the tables into CSV files. Below the left image shows the original relationships for the data set, the right image shows the model after the cleaning process. Given the stakeholder's questions pertained to sales data, i decided to omit the item details tables from the model. Next I performed the following steps in SSMS (Click here for SQL):
- Removed redundant price and product name features from the sales table
- Converted the price feature to a single currency unit (CP/SP -> GP)
- Converted the date feature from varchar to MM/DD/YYYY date format
- Removed 72 rows with blank sales id from the sales table, all records showed a 9,999 quantity
- Removed 116 rows with blank product id from the sales table
- Removed 3,794 duplicate sales records from the sales table (matching sales id and date)
When I first encountered the blank sale id records in the sales table, I planned on just generating unique values, but then I noticed every quantity was 9,999. I decided to discard the values since the sales table had 54,222 remaining records. I followed a similar thought process regarding the records with blank product ids. This was a toy example, so I decided to update the tables before pulling the data into Power BI, but if I was working on an actual database, I would've just filtered out the problem records before pulling the tables. Next, I started to answer the stakeholder's questions, below are the SQL queries and results. I decided to go with a CTE for the subtotal queries, in an attempt to improve readability from code block to code block, but this may have been easier to understand with simply creating a subtotal view for the queries. (SQL answer file):
-Answers / SQL Queries
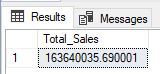
                                    Total Sales

                                       SELECT   SUM(Cast(s.quantity AS INT) * Cast(p.price AS FLOAT)) AS Total_Sales
                                        FROM    [bg3].[dbo].[sales] AS s
                                                INNER JOIN [bg3].[dbo].[all_products] AS p
			        	                            ON s.product_id = p.product_id
                                        WHERE	s.quantity <= 5000 AND
		                                        s.product_id not like '';
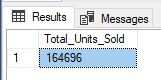
                                    Total Units Sold

                                        SELECT	SUM(CAST(quantity AS int)) AS Total_Units_Sold
                                        FROM	[bg3].[dbo].[sales]
                                        WHERE	quantity <= 5000 AND
		                                        product_id not like '';
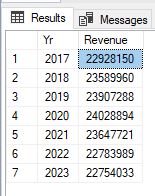
                                    Total Sales Year by Year

                                        WITH    subtotal
                                                AS (SELECT DISTINCT s.sale_id,
                                                                    s.date,
                                                                    Cast(s.quantity AS INT) * Cast(p.price AS FLOAT) AS
                                                                    total
                                                    FROM    [bg3].[dbo].[sales] AS s
                                                            INNER JOIN [bg3].[dbo].[all_products] AS p
                                                                ON s.product_id = p.product_id
                                                    WHERE   s.quantity <= 5000 AND
			        	                                    s.product_id not like '')
                                        SELECT  Year(date)           AS Yr,
                                                Round(Sum(total), 0) AS Revenue
                                        FROM    subtotal
                                        GROUP   BY Year(date)
                                        ORDER   BY Yr;
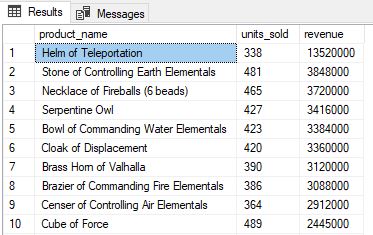
                                    Total Sales by Product

                                        WITH    subtotal
                                                AS (SELECT DISTINCT s.sale_id,
                                                                    p.product_name,
                                                                    s.quantity,
                                                                    Cast(s.quantity AS INT) * Cast(p.price AS FLOAT) AS
                                                                    total
                                                    FROM    [bg3].[dbo].[sales] AS s
                                                            INNER JOIN [bg3].[dbo].[all_products] AS p
                                                                ON s.product_id = p.product_id
                                                    WHERE   s.quantity <= 5000)
                                        SELECT  product_name,
                                                Sum(Cast(quantity AS INT)) AS units_sold,
                                                Round(Sum(total), 0)       AS revenue
                                        FROM    subtotal
                                        GROUP   BY product_name
                                        ORDER   BY revenue DESC;
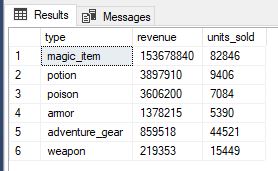
                                    Total Sales by Product Type

                                        WITH    subtotal
                                                AS (SELECT DISTINCT s.sale_id,
                                                                    p.type,
                                                                    s.quantity,
                                                                    Cast(s.quantity AS INT) * Cast(p.price AS FLOAT) AS
                                                                    total
                                                    FROM    [bg3].[dbo].[sales] AS s
                                                            INNER JOIN [bg3].[dbo].[all_products] AS p
                                                                ON s.product_id = p.product_id
                                                    WHERE   s.quantity <= 5000)
                                        SELECT  type,
                                                Round(Sum(total), 0) AS revenue,
	                                            SUM(CAST(quantity AS int)) AS units_sold
                                        FROM    subtotal
                                        GROUP   BY type
                                        ORDER   BY revenue DESC;
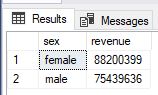
                                    Total Sales by Gender

                                        WITH    subtotal
                                                AS (SELECT DISTINCT s.sale_id,
                                                                    s.customer_id,
                                                                    s.quantity,
                                                                    Cast(s.quantity AS INT) * Cast(p.price AS FLOAT) AS
                                                                    total
                                                    FROM    [bg3].[dbo].[sales] AS s
                                                            INNER JOIN [bg3].[dbo].[all_products] AS p
                                                                ON s.product_id = p.product_id
                                                    WHERE   s.quantity <= 5000 AND
			        	                                    s.product_id not like '')
                                        SELECT  c.sex,
                                                Round(Sum(Cast(s.total AS FLOAT)), 0) AS revenue
                                        FROM    subtotal AS s
                                                INNER JOIN [bg3].[dbo].[customers] AS c
                                                    ON c.customer_id = s.customer_id
                                        GROUP   BY c.sex
                                        ORDER   BY revenue DESC;
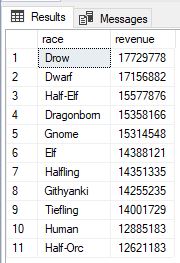
                                    Total Sales by Race/Species

                                        WITH    subtotal
                                                AS (SELECT DISTINCT s.sale_id,
                                                                    s.customer_id,
                                                                    s.quantity,
                                                                    Cast(s.quantity AS INT) * Cast(p.price AS FLOAT) AS
                                                                    total
                                                    FROM    [bg3].[dbo].[sales] AS s
                                                            INNER JOIN [bg3].[dbo].[all_products] AS p
                                                                ON s.product_id = p.product_id
                                                    WHERE   s.quantity <= 5000)
                                        SELECT  c.race,
                                                Round(Sum(Cast(s.total AS FLOAT)), 0) AS revenue
                                        FROM    subtotal AS s
                                                INNER JOIN [bg3].[dbo].[customers] AS c
                                                    ON c.customer_id = s.customer_id
                                        GROUP   BY c.race
                                        ORDER   BY revenue DESC;
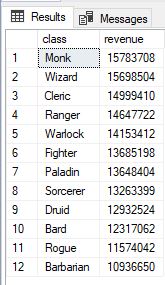
                                    Total Sales by Class

                                        WITH subtotal
                                            AS (SELECT DISTINCT s.sale_id,
                                                                s.customer_id,
                                                                s.quantity,
                                                                Cast(s.quantity AS INT) * Cast(p.price AS FLOAT) AS
                                                                total
                                                FROM    [bg3].[dbo].[sales] AS s
                                                        INNER JOIN [bg3].[dbo].[all_products] AS p
                                                            ON s.product_id = p.product_id
                                                WHERE   s.quantity <= 5000)
                                        SELECT  c.class,
                                                Round(Sum(Cast(s.total AS FLOAT)), 0) AS revenue
                                        FROM    subtotal AS s
                                                INNER JOIN [bg3].[dbo].[customers] AS c
                                                   ON c.customer_id = s.customer_id
                                        GROUP   BY c.class
                                        ORDER   BY revenue DESC;
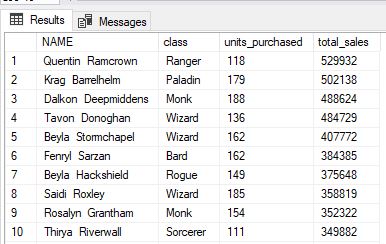
                                    Total Sales Per Customer

                                        WITH subtotal
                                            AS (SELECT DISTINCT s.sale_id,
                                                                s.customer_id,
                                                                s.quantity,
                                                                Cast(s.quantity AS INT) * Cast(p.price AS FLOAT) AS
                                                                total
                                                FROM    [bg3].[dbo].[sales] AS s
                                                        INNER JOIN [bg3].[dbo].[all_products] AS p
                                                            ON s.product_id = p.product_id
                                                WHERE   s.quantity <= 5000)
                                        SELECT  c.NAME,
                                                c.class,
                                                Sum(Cast(s.quantity AS INT)) AS units_purchased,
                                                Round(Sum(total), 0)         AS total_sales
                                        FROM    subtotal AS s
                                                INNER JOIN [bg3].[dbo].[customers] AS c
                                                    ON s.customer_id = c.customer_id
                                        GROUP   BY  c.NAME,
                                                    c.class
                                        ORDER   BY total_sales DESC;
-Dashboarding
Once i had the tables situated from SSMS i pulled them into Power BI. I performed the following steps in the Power Query Editor:
- Set the data type for table features (more on this later)
- Filtered and removed sales records with quantity values over 5,000 using a custom column
- Used DAX to generate calculated custom column's for total sales, price category, and age category
- Created a date table using DAX
- Added the relationships to the data model for filtering
With the data model setup, I created new measure items for units sold, overall sales, and sales for each of the product types. I setup three panels for the dashboard: Sales, Customers, and Products. The three panels share the same skeleton with the time series slicers at the top, and the side selectors filter the figures on customers and products. Item's dynamically update based on the slicers or selected items within other figures, though I have disabled some interactions. For example, choosing 2017 on the Year slicer at the top updates all the figures on the sales panel except the Total Sales by Year figure, as this would only be a single dot on the line graph. The Sales panel provides insights on the stakeholder's questions regarding year-by-year revenue, units sold by product type, and top customers. The Customer panel takes a deeper look into the consumer demographics, exploring a variety of customer characteristics including gender, class, race, and age. This panel will provide the stakeholder with the requested customer demographic information. The final panel covers product details, the table at the top displays total sales for each year, along with sales figures for each type of product. The panel also includes figures show the top products by sales, units sold, and price category. The figures provided on the panel will help to answer the product profitability questions the stakeholder had in the beginning.
-Suggestions
Originally, I had a pie chart showing the total sales based on product type on the Sales panel, but the magical items category dominates the emporium's revenue at roughly 94%. The shop showed steady growth from 2017 to 2020 thanks to the sales of these magical items, with the category making up over 50% of the total units sold. In fact, every year but the two most recent has magical items at or above half of all items sold within the shop. These final two years coincide with the two lowest performing years in terms of total sales. I would suggest a renewed focus on the marketing of these items. While its not all bad news for the final two years, poison sales are almost 18% from 2022 to 2023. Potion sales are also at the second-highest total by year for the emporium, a 12% increase from the previous year. These are the next two highest product categories in terms of total sales, but each category only accounts for roughly 2% of the total sales over the past seven years. If the stakeholder wants to market to a specific group, I suggest the Drow and Dwarf races. These two customer races account for the largest number of total sales in magical items, poison, and potions. The renewed emphasis on magical items will make the most impact on total sales.
-Future Analysis / Final Thoughts
I am a huge fan of the game series, and the data set provided a good opportunity to work with multiple tables in both SSMS and Power BI. While working though the stakeholder's questions and performing some preliminary EDA I found a variety of issues with the data: missing values, duplicated rows, and incorrectly formatted data. This was a great way to practice the data cleaning process in both SQL and Power Query, and ultimately was a great reminder to always check your data types when importing tables into Power BI. I had finished the calculated measures and columns, generated all the tables and visuals, the dashboard was complete. The final step was to verify the values against the SQL queries and then I was finished, unfortunately the values didn't match up. To make a long story short, the price field on the all products table was set as an integer (whole number) and not a decimal value. It truncated all those prices less than 1 gp to zero, which caused all the calculated measures to come in under the true value. Once I identified the problem it was an easy fix but did cause me to double check the SQL queries and the data transformation applied steps in Power Query.
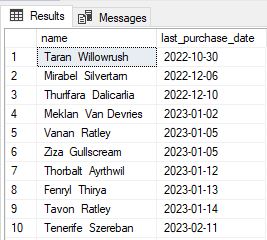
If there was more time or resources available, I would like to collect data regarding the cost of each product from Mr. Gearspark. With that data available we could dive into the profitability of the Gearspark's Emporium and provide a deeper insight into which products generate the best margins for the shop. The final measure I thought about adding to the dashboard was a last purchase date for each customer, but I didn't want a large list element on the dashboard for the stakeholder to scroll through. This would probably be something I would inquire whether this was information they wanted displayed on the dashboard or not, I'll provide the SQL query and snippet below:
                                Last Purchase Date For Customers

                                    SELECT	c.name,
                                    		MAX(CAST(s.date as date)) as last_purchase_date
                                    FROM	[bg3].[dbo].[sales] s
                                    		INNER JOIN [bg3].[dbo].[customers] c
                                    			ON s.customer_id = c.customer_id
                                    GROUP	BY c.name
                                    ORDER	BY last_purchase_date;